Translation note: This presentation was published in November 2022. Figures, preliminary calculations and descriptions of data availability are reproduced as reported then; some totals and percentages use different bases and should not be treated as a reconciled current dataset.
INTRODUCTION
Russia’s full-scale war against Ukraine, active hostilities, bombardment and fires at industrial and energy facilities, oil depots and forests release large quantities of air pollutants.
According to the Environment Ministry’s EcoZagroza system, air suffered the greatest assessed environmental damage from hostilities. As of 4 November 2022, preliminary State Environmental Inspectorate calculations under the approved methodology put air pollution damage at UAH 927 billion , representing 67,51% of total environmental damage of UAH 1,373 billion. The original presentation lists atmospheric damage from burning petroleum products at UAH 49,360 million, forest fires at UAH 8,720,414 million, and other facility fires at UAH 6,981 million.
At the same time, Ukraine lost part of its industrial and energy capacity, business activity declined, the fuel crisis reduced vehicle use and displaced people working remotely needed fewer journeys. The presentation cites UN refugee figures of more than 11 million departures during the first six months, reducing pollution pressures associated with these activities. War exposed many urgent problems requiring thorough research to support sound decisions across all levels and sectors of government.
MAIN DISCUSSION
Objectively calculating damage from wartime air emissions is difficult. Pollutants disperse and move at rates depending on atmospheric pressure, humidity, wind speed, terrain and other factors.
The State Environmental Inspectorate calculates fugitive pollutant emissions during emergencies or martial law under the approved methodology for estimating such emissions and resulting damage. Where the mass of material burned is known, it calculates the mass of each pollutant or mixture emitted from the source. Damage is assessed using, among other evidence, materials confirming that atmospheric pollution occurred.
A comprehensive analysis of the war’s air quality effects also needs ambient monitoring data. Information on emissions directly caused by hostilities alone cannot show the full picture of wartime air quality changes.
Since the full-scale invasion began, access to substantial environmental datasets has become difficult or closed altogether. Authorities cite security or lack of funding. Ukrainian Hydrometeorological Centre data could not be analysed because open-format data and access to its website were unavailable. SaveDnipro therefore piloted an analysis of PM2.5 in Kyiv, Lviv and Dnipro using ambient data aggregated by SaveEcoBot, comparing the invasion period with the first half of 2021. Sources included SaveDnipro’s SaveEcoSensor stations, the Dnipropetrovsk Regional Council’s Environmental Monitoring Centre municipal enterprise,, the Kyiv Regional State Administration’s Department of Ecology and Natural Resources,, and LUN Misto..
Seasonal patterns changed little despite the war: the compared periods show higher PM2.5 in spring and a sharp fall in May. There is a difference, however: while 2021 peaks sometimes exceeded the stated limit, wartime readings did not cross it in any of the studied cities. See Figures 1, 2 and 3.
Figure 1. PM2.5 air quality in Kyiv, January 2021–July 2022
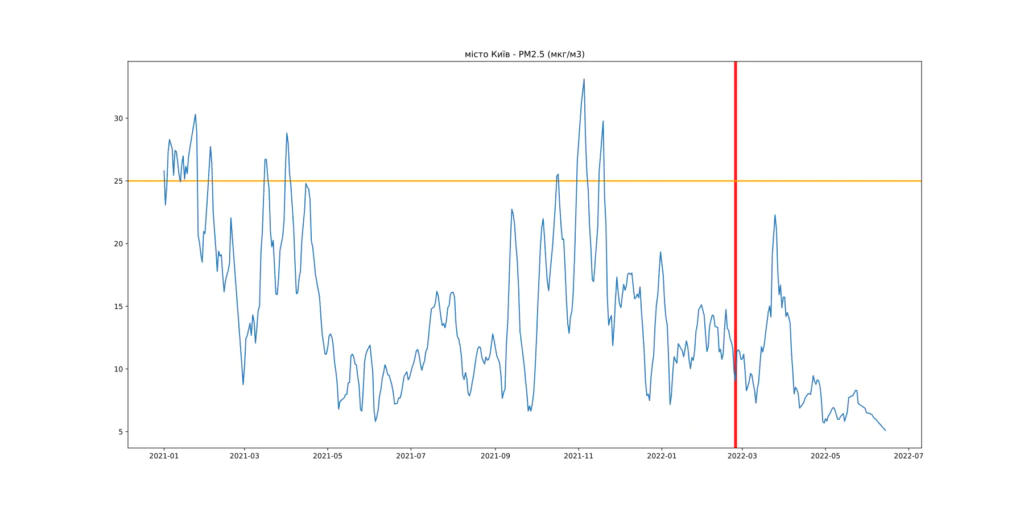
Figure 2. PM2.5 air quality in Lviv, January 2021–July 2022
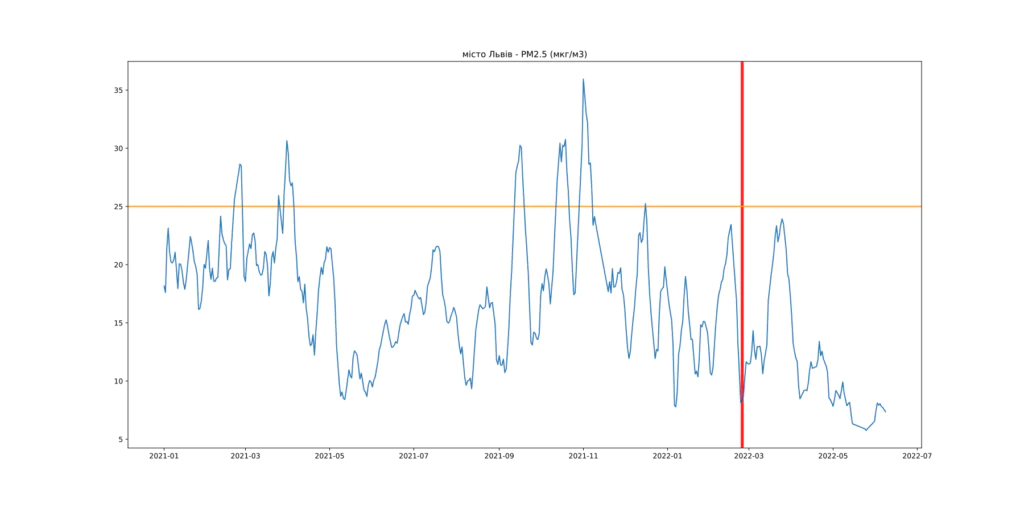
Figure 3. PM2.5 air quality in Dnipro, January 2021–July 2022
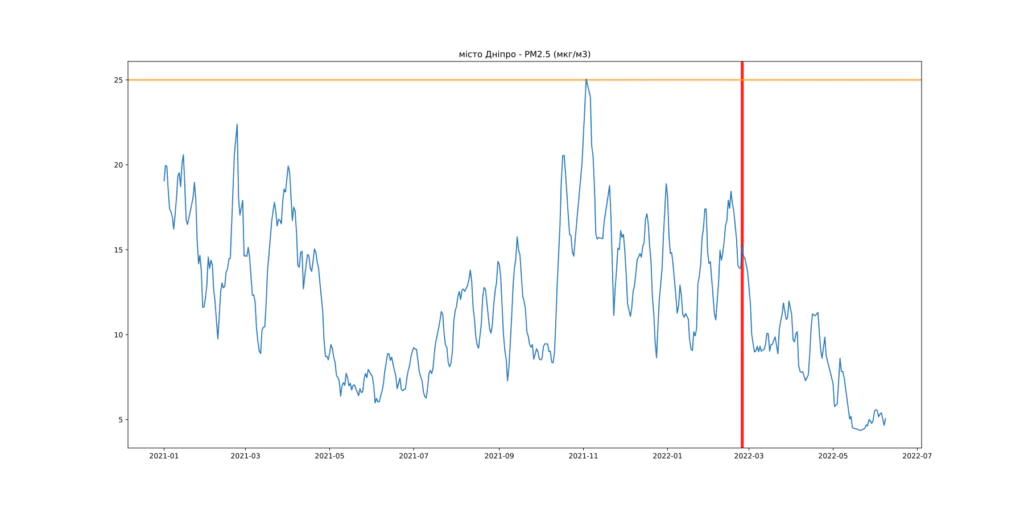
The analysis suggests that economic and industrial activity and heavy traffic are major urban PM2.5 sources. Data from the invasion’s first months, when Kyiv for example almost emptied, support this interpretation. PM2.5 air quality improved in the studied cities over this period. This conclusion cannot be extended nationwide, because pollution from other sources, including oil depot fires caused by enemy attacks and forest fires, increased.
In the early period of the full-scale war, Russian forces struck oil infrastructure at least 36 times; see Figure 4.
Figure 4. Russian strikes on Ukrainian oil infrastructure during the first 100 days of the full-scale war
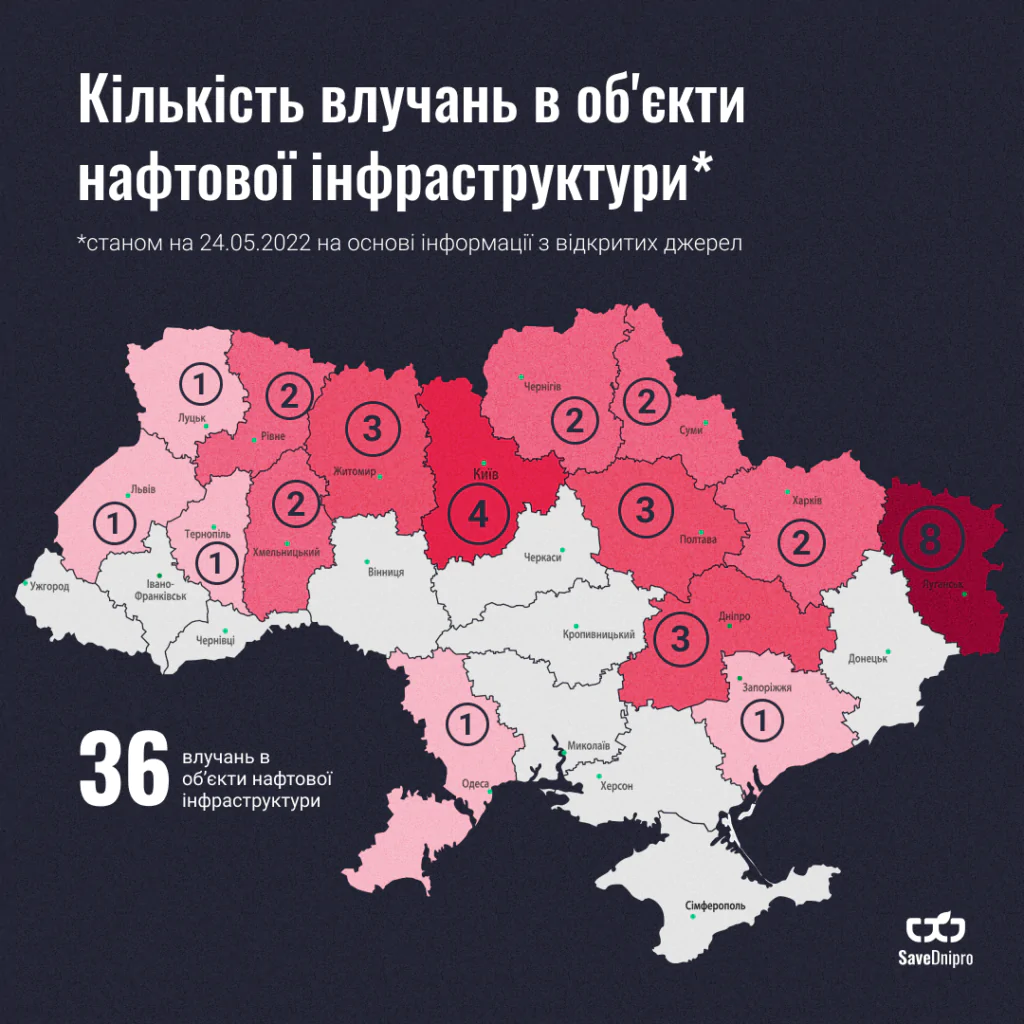
Over eight months of the invasion, the State Environmental Inspectorate’s regional and interregional bodies recorded 680,618 tonnes of petroleum products burned in attacks.
To investigate Russia’s crimes and collect the fullest possible evidence, existing air monitoring data must be aggregated and openly accessible. Investigators in the Prosecutor General’s specialised environmental prosecution service, for example, lack a complete list of monitoring station owners from whom they could promptly obtain evidence of environmental harm.
State air quality monitoring is governed by the Law on Environmental Protection, Cabinet Resolution No. 391 of 30 March 1998 on the state environmental monitoring system, and Resolution No. 827 of 14 August 2019 on state ambient air monitoring. A bill on the state environmental monitoring system, environmental information and information support for environmental management also awaits parliamentary consideration.
Ukraine still lacks a single open-access tool for all state monitoring data. Monitoring bodies collect, process and use data separately, usually without publishing raw observations. Local authorities preparing zone and agglomeration monitoring programmes for Ministry approval also do not combine data into one system for responding to requests. EcoZagroza could serve this purpose; it currently receives air monitoring data through APIs from SaveEcoBot and other non-state systems.
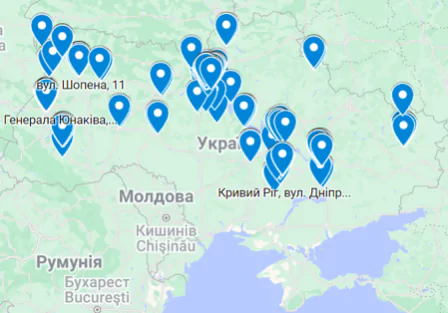
SaveDnipro is mapping monitoring stations for use by everyone interested. The map will include state, business and private systems. We have collected locations for 218 state air quality stations: Volyn zone, 17; Kyiv zone, 28; Kirovohrad zone, 5; Luhansk zone, 8; Poltava zone, 5; Rivne zone, 3; Ternopil zone, 2; Chernivtsi zone, 3; and the agglomerations of Vinnytsia, 2; Dnipro, 18; Zhytomyr, 8; Zaporizhzhia, 5; Ivano-Frankivsk, 21; Kyiv, 18; Kryvyi Rih, 38; Lviv, 15; Mariupol, 6; Poltava, 4; Sumy, 4; Khmelnytskyi, 2; Cherkasy, 4; and Chernihiv, 2. See Figure 5.
Figure 5. Mapping air quality stations operated by state monitoring bodies
CONCLUSIONS
Among environmental components whose damage is recorded by state oversight bodies, the presentation identifies air as the most affected, accounting for around 77%.
Systematic analysis must consider both harmful factors, such as strikes on oil infrastructure and fires at industrial, energy and forest sites, and factors that reduce air emissions while harming the country: industrial crisis, lower business activity, reduced driving because of fuel costs and displacement. The presentation cites more than 11 million departures and their associated reduction in domestic pollution pressures. Such analysis can underpin sound legislation, reforms and management decisions on air pollution.
Ukraine’s capacity for systematic analysis remains inadequate because it still lacks a unified state air quality monitoring system. Separate bodies collect and use data independently or restrict access, contrary to Article 50 of the Constitution and the Aarhus Convention. Investigators cannot promptly obtain data from state monitoring bodies or businesses, slowing evidence collection for compensation claims against the aggressor. A unified system enabling rapid wartime monitoring and analysis is also a civilian safety priority, given hostilities and possible enemy use of chemical weapons.
The gradual shutdown of major industries, especially in eastern and southern Ukraine, reduced emissions from organised sources, as city-level studies such as Dnipro’s indicate. This reinforces the urgent need for industrial management reform based on European best available techniques and Directive 2010/75/EU. Reform is even more pressing as international reconstruction funding may depend on appropriate Ukrainian legislation.
Existing urban air quality analyses also support changing logistics, freight and municipal transport systems to develop cleaner transport and the infrastructure needed to use it.
RECOMMENDATIONS
The analysis raises practical questions for authorities, civil society and businesses: how can we collect sufficient evidence for fair reparations, gather and use air monitoring data, and improve urban air quality after hostilities end?
The answers largely require appropriate legislative and administrative decisions.
- Ensure implementation and enforcement of Directive 2010/75/EU of 24 November 2010 on industrial emissions and integrated pollution prevention and control.
- Improve environmental monitoring legislation by adopting a sound version of the bill on the state environmental monitoring system, environmental information and information support for environmental management.
- Fund a state air quality monitoring system within environmental monitoring as an essential means of documenting harm and a civilian safety priority.
- Aggregate all state monitoring bodies’ data and create one freely accessible tool for monitoring, oversight, analysis and decision-making.
- Establish air quality data exchange between central executive bodies responsible for environmental protection, oversight and investigation.
- Support cleaner municipal transport, reduce private vehicle use in settlements and provide infrastructure for individual environmentally responsible mobility, including electric mopeds, scooters and bicycles.
BIBLIOGRAPHY
State Environmental Inspectorate website: www.dei.gov.ua/posts/2408
EcoZagroza website: https://ecozagroza.gov.ua
Verkhovna Rada of Ukraine website: https://itd.rada.gov.ua
SaveEcoBot website: www.saveecobot.com
SaveDnipro website: www.savednipro.org