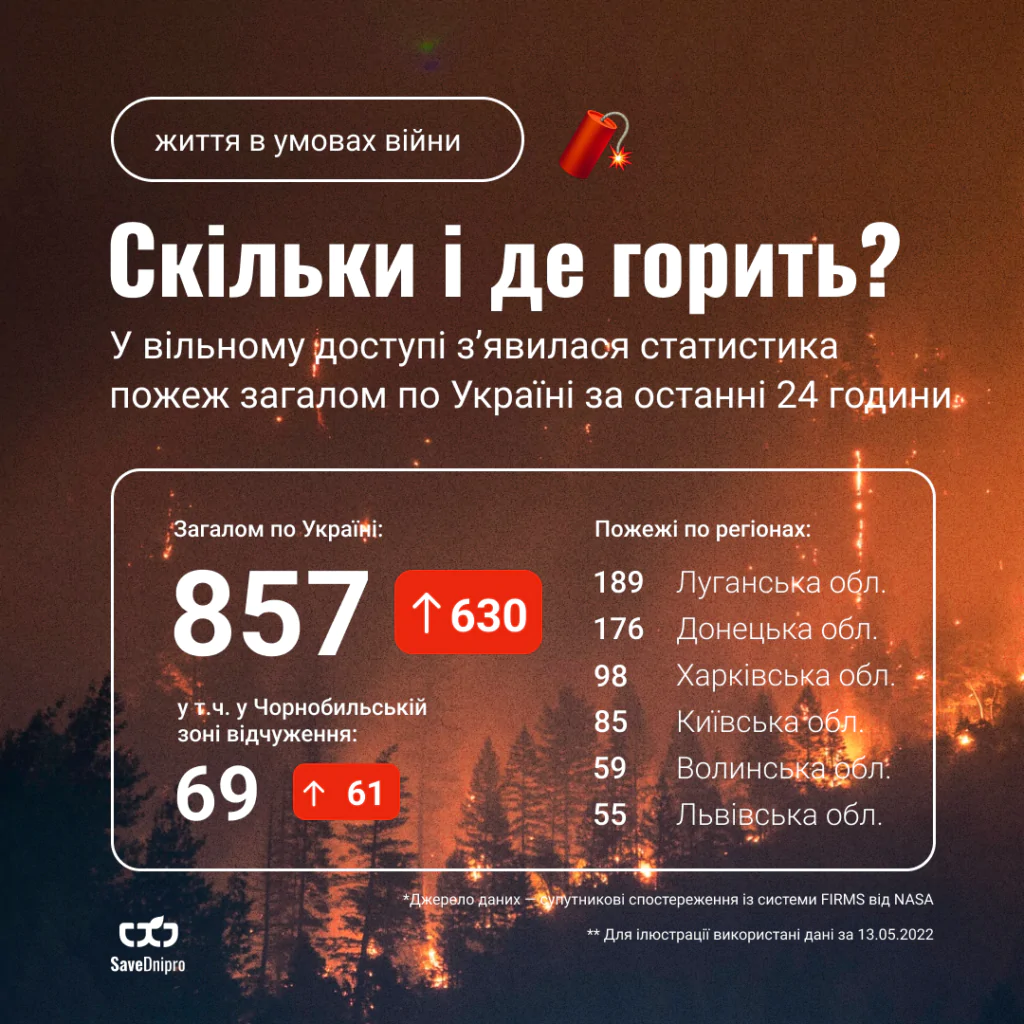
The number of fire hotspots in each region over the past 24 hours is collected by Saveecobot and displayed on a dedicated page of the website.
SaveEcoBot automatically collects NASA FIRMS data every hour, identifies hotspots within Ukraine, counts them and displays them on the fire map.
The statistics page shows regional fire counts in an infographic, changes in regional counts in a table, and a chart of fires over recent weeks.
Fire counts within the Chornobyl Exclusion Zone are shown separately.
You can also enable an additional map layer showing occupied territories and areas of active hostilities.